Volume 19, number 8
Issue #2108
April 29, 2021
Single Issue $15.00
- Balanced Portfolio gains ground
- A fixed-income proxy for conservative investors
- Gordon Pape’s updates: Procter & Gamble, CI U.S. & Canada Lifeco Income ETF, BMO Emerging Markets Bond Hedged to CAD Index ETF, Harvest Healthcare Leaders Income ETF
- Your Questions: Tax-efficient retirement; Tax advantages of REITs; Closed-end funds
- Next update edition: May 13
Printable PDF
BALANCED PORTFOLIO GAINS GROUND
By Gordon Pape, Editor and Publisher
In September 2011, I set up a Balanced Portfolio that offers a conservative mix of stocks, bonds, and cash. This type of portfolio is likely to underperform when stock markets are strong but reduces risk when bear markets emerge.
That’s what we’ve seen here. The portfolio was down about 14% at the time of the March 2020 stock plunge, but that was a much better result than the overall market produced.
One reason for that was that in 2019, I increased the bond weighting to 42.5% from 34.5%. Bonds lost ground when the market fell, but they did much better than stocks.
Since then, the portfolio has rebounded strongly, as we’ll see in a moment.
This portfolio was launched in September 2011, with an initial valuation of $25,027.75. The goal was to achieve a return that at least matched the best available five-year GIC rate plus two percentage points.
That means the target varies with the rise and fall of interest rates. The best five-year rate I can find right now is 2.1% from Oaken Financial, which would make our current target 4.1%.
Here’s a summary of the securities we currently hold and how they performed over the period since I last reviewed this portfolio last October. Prices are as of the close of trading on April 23.
CI First Asset High Interest Savings ETF (TSX: CSAV). The fund invests in high-interest savings accounts at five Canadian banks – CIBC, RBC, BMO, Scotiabank, and National Bank – at above-average negotiated rates. The unit price hardly ever budges from the $50.00-$50.10 range. We have received six monthly distributions since the last update in October, for a total of $0.149 per unit.
iShares Core Canadian Universe Bond Index ETF (TSX: XBB). This fund tracks the performance of the broad Canadian bond market. It’s been a bad stretch for bonds as yields on 10-year government issues have risen, knocking back prices. The units have lost $1.74 since the last update. We received monthly distributions totalling $0.419 per unit.
Canadian Apartment Properties REIT (TSX: CAR.UN). This REIT invests in apartment units across Canada. Most of the REIT sector was hit by panic selling when the pandemic took hold, as investors were concerned tenants would default on rent. CAR dropped to the $42 level in March 2020 and was trading only a couple of dollars higher at the time of our October review. However, it has rebounded strongly in the most recent six months, gaining almost $11 per unit. We received monthly distributions totaling $0.69 per unit over the period.
Pembina Pipeline Corp. (TSX: PPL, NYSE: PBA). Any stock associated with the conventional energy sector was whipsawed last year. But we’re now seeing a recovery in the sector. Pembina’s price has gained $8.36 since the last review, helped by the company’s repeated insistence that it would maintain its monthly $0.21 dividend. It has done so, and the increase in the share price has pushed down the yield to 7.1%, from 8.9% at the time of the last review.
Brookfield Renewable Partners (TSX: BEP.UN, NYSE: BEP). This renewable energy limited partnership split its units 3 for 2 in December, meaning you received an additional 50 units for every 100 you owned. We have adjusted the cost base to reflect the split. Due to timing, we received just one quarterly distribution during the review period.
Brookfield Infrastructure Limited Partnership (TSX: BIP.UN, NYSE: BIP). This Brookfield partnership invests in infrastructure projects world-wide: railroads; ports; transmission lines; toll roads; etc. It continues to perform well, with the units advancing about $6 in the latest six months. Both BEP and BIP recently increased their distributions by 5%.
BCE Inc. (TSX, NYSE: BCE). We added Canada’s largest telecom company to the portfolio last October at $56.20 per share. Since then, the stock is up $1.93, and we received two dividends for a total of $1.708 per share. Total gain for the six months was 6.5%.
Bank of Montreal (TSX, NYSE: BMO). The financial sector was hit hard by last year’s March selloff but has recovered strongly. BMO shares are up almost $32 in the latest six-month period, and we are receiving quarterly dividends of $1.06 per share. At the sharply higher price, the yield is down to 3.7% from 6.8% last fall.
Cash. We invested $2,165.22 in a high interest savings account with Motive Financial that was paying 1.55% at the time. We earned interest of $16.78 for the period.
Here’s how the portfolio stands now. Commissions have not been factored in. For simplicity, Canadian and U.S. dollars are treated as being at par for purposes of the calculations.
Income Investor Balanced Portfolio (a/o April 23/21)
SecurityWeight
%Total
SharesAverage
CostBook
ValueMarket
PriceMarket
ValueRetained
IncomeGain/
Loss
%CSAV 18.4
185
$50.06
$9,261.10
$50.02
$9,253.70
$67.72
+0.07
XBB 15.7
250
$32.04
$8,010.20
$31.61
$7,902.50
$339.50
+ 2.9
CAR.UN 8.8
80
$49.69
$3,975.20
$55.30
$4,424.00
$220.80
+18.7
PPL 5.9
80
$47.49
$3,799.50
$36.91
$2,952.80
$100.80
-19.6
BEP.UN 21.3
210
$11.98
$2,516.10
$50.90
$10,689.00
$90.78
+328.4
BIP.UN 12.0
90
$16.58
$1,492.30
$67.10
$6,039.00
$568.00
+342.7
BCE 6.9
60
$56.20
$3,372.00
$58.13
$3,487.80
$102.48
+ 6.5
BMO 9.2
40
$108.26
$4,330.40
$116.01
$4,640.40
$412.80
+16.7
Cash 1.8
$873.33
$890.11
Total 100.0
$37,630.13
$50,279.31
$1,902.88
+38.7
Inception $25,027.75
+108.5
Comments: The stock markets were strong during the latest period, and our portfolio reflected that, gaining 9.6% in six months. This was despite having about one fifth of the portfolio sitting in a cash ETF at the start of the period and another 18% in a bond fund.
The cumulative gain since inception a little over nine and a half years is 108.5%. That works out to an average annual compound growth rate of 7.87%. That’s well above target.
Changes: The portfolio is performing well, but it is still too heavily weighted to Brookfield Energy Partners. Therefore, we will sell 50 units of BEP.UN for a total of $2,545.
We will use the money to buy shares in Fortis Inc. (TSX, NYSE: FTS), adding a utility stock to this portfolio. Fortis closed on April 23 at $55.37, so we will buy 45 shares for a total cost of $2,491.65. We will add the balance of $53.35 to our cash account.
Fortis is based in St. John’s but operates in the U.S. as well as Canada. It’s a stable company and should outperform if there is a stock market correction. The shares pay a quarterly dividend of $0.505 ($2.02 per year) to yield 3.6% at the current price.
I’m not content with the performance of CSAV. It’s safe, but the return is minuscule. We need a somewhat better performance from this money, but we also need to retain an appropriate cash/fixed income ratio in the portfolio.
Accordingly, we will sell our units in CSAV for $9,253.70. Add retained earnings of $67.72, and we have $9,321.42 to invest.
We’ll put $5,000 into a one-year GIC with Peoples Bank, paying 1.55% at maturity on April 23, 2022. That’s not a great return, but it’s better than CSAV is providing.
We’ll use the rest to buy 230 units of the iShares Convertible Bond Index ETF (TSX: CVD). It’s one of the few bond ETFs in the black this year, with a year-to-date gain of 3.74%. The units are trading at $18.59, for an investment of $4,275.70.
That leaves $45.72, which we’ll add to cash.
In addition, we’ll use retained income to add to our existing position in XBB. We will buy another 10 units at a cost of $316.10, bringing our position to 260 units. That will leave retained earnings of $23.40.
All else remains the same.
We now have a cash balance of $2,508.24, which will continue to be invested with Motive Financial’s Savvy Savings Account. The rate has dropped to 1.25%.
Here is the revised portfolio. I will review it again in September.
Income Investor Balanced Portfolio (revised April 23/21)
SecurityWeight
%Total
SharesAverage
CostBook
ValueMarket
PriceMarket
ValueRetained
IncomeGIC 9.9
1
$5,000.00
$5,000.00
$5,000.00
$5,000.00
$0
CVD 8.4
230
$18.59
$4,275.70
$18.59
$4,275.70
$0
XBB 16.2
260
$32.02
$8,326.30
$31.61
$8,218.60
$23.40
CAR.UN 8.7
80
$49.69
$3,975.20
$55.30
$4,424.00
$220.80
PPL 5.8
80
$47.49
$3,799.50
$36.91
$2,952.80
$100.80
BEP.UN 16.1
160
$11.98
$1,916.18
$50.90
$8.144.00
$90.78
BIP.UN 11.9
90
$16.58
$1,492.30
$67.10
$6,039.00
$568.00
BCE 6.9
60
$56.20
$3,372.00
$58.13
$3,487.80
$102.48
BMO 9.2
40
$108.26
$4,330.40
$116.01
$4,640.40
$412.80
FTS 4.9
45
$55.37
$2,491.65
$55.37
$2,491.65
$0
Cash 2.0
$989.18
$989.18
Total 100.0
$39,968.41
$50,663.13
$1,519.06
Inception $25,027.75
Follow Gordon Pape’s latest updates on Twitter: http://twitter.com/GPUpdates
Return to the table of contents…
A FIXED-INCOME PROXY FOR CONSERVATIVE INVESTORS
By Richard Croft, Associate Publisher
Despite the strong performance of North American equities, some stocks have been left behind. Notable among the group is BCE Inc. (TSX: BCE), which recently traded at $58.50. That’s well off its highs of August 2016 when the stock traded above $63 per share.
BCE is not a growth company. Because of its size and strategy, there are better places to seek growth. However, for those seeking income within a diversified portfolio, the company is a strong candidate to provide a tax-advantaged cash flow.
While a growth investor would not necessarily gravitate to BCE, income investors who recognize the value of diversification within a portfolio could do worse than this blue-chip stalwart in the Canadian market. The company is rich in cash flow and has a management team intent on giving back to shareholders. BCE has increased its quarterly dividend 17 times since the financial crisis over a decade ago. The most recent bump was announced in January, which saw the quarterly dividend rise to $0.877 per share. Given the trajectory of the dividends, income investors might consider BCE as an alternative to bonds within a portfolio. This strategy is not as far-fetched as you might think.
You may recall that prior to the financial crisis, BCE was in play. The Ontario Teacher’s Pension Plan (OTPP) wanted to use the cash flow from continuing operations to fund a portion of its pension liabilities, which sounds a lot like a fixed-income alternative. The initial deal fell apart when two hedge funds that were partnering with OTPP were caught with a flood of redemptions at the height of the financial crisis. In the end, the hedge fund partners could not come up with their share of the capital necessary to take BCE private.
But since the fallout from the financial crisis, BCE management has done exactly what the OTTP thought was reasonable: increasing dividends to the point that it looks and acts like a high-end income trust with a tax-efficient distribution plan.
In the current environment, you could argue that what is bad for bonds is probably not good for BCE. All true to a point. However, with interest rates expected to rise, we know with certainty that fixed-income securities will fall in price. Such is the teeter-totter effect, where bond and preferred share prices move inversely to the direction in interest rates. The price of a bond or fixed-rate preferred share will rise when interest rates are falling and vice versa.
For BCE, the linkage between rising rates and a lower stock price is not as clear cut. To begin with, the yield on BCE (5.938% given the most recent dividend increase) is well above the 1.55% rate payable on 10-year Government of Canada bonds. As such, there is some room to maneuver in a market where BCE’s income is also expected to increase. To that point, the variability in BCE’s cash flow gets reflected in management’s push to continually bump up the dividend, which is vastly different from the fixed interest payable on a bond.
Secondly, what is underlying the higher interest rate scenario is a normalization of the economy, which means more growth and perhaps higher inflation. Any runup in growth is positive from BCE’s earnings trajectory, and while an increase in inflation is not a positive, it is certainly not a major negative for the company.
What we have, then, is a company you can use as a fixed-income proxy in a conservative portfolio. Given historical trends where management tends to increase dividends each year, I would not suspect another increase in 2021. So, you might think about augmenting the cash flow from the quarterly dividend by selling covered calls on BCE.
Augmenting returns with options
The sale of covered calls increases the total return from the position. By selling, say, the BCE December 60 calls at $0.90 per share, the covered call adds the equivalent of another dividend in 2021. Under the current rules, income from the sale of an option is taxed as a capital gain. Thankfully, the federal government did not change capital gains inclusion rates in its April 19 budget.
Think of the premium received from the call option as an enhancement to the overall strategy. Again, this is not possible with a fixed-income instrument. From a risk perspective, the sale of the call option also provides some downside protection by reducing your per-share cost base from $58.50 to $57.60 (that’s calculated as the $58.50 current price less the $0.90 per share option premium = $57.60 per share out of pocket).
Keeping with our fixed-income alternative analogy, the yield to maturity, over the next eight months is 6.12%, assuming the stock remains where it is currently trading. You will receive three dividends totaling $2.63 per share plus the $0.90 cents per share option premium (see accompanying table).
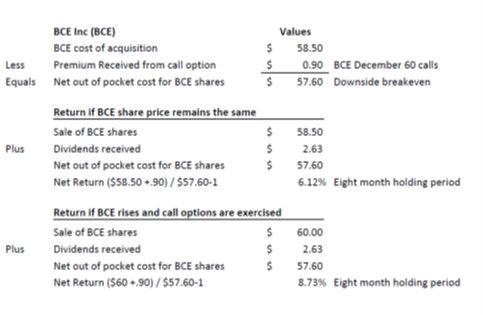
If BCE shares are called, you will have to sell your share at $60 in December. In that scenario, the return gets bumped to 8.54%. This assumes the current stock price ($58.50), the sale price if assigned ($60), the premium received ($0.90), plus three dividends totaling $2.63.
As you can imagine, there are many Canadian opportunities to exploit the covered call writing strategy. It is particularly interesting when looking at the Canadian banks. The return-if-unchanged metrics are not as good as with BCE Inc. However, I suspect banks will begin bumping their dividend payouts – probably every six months – when the Bank of Canada allows them to do so, probably sometime in the third quarter.
Currently, Canadian banks are flush with cash that will most likely get returned to shareholders. Unlike BCE Inc., I think the big five Canadian banks have more upside and will benefit from any rise in interest rates.
The strategy will work with any of the banks and my view extends to any of the big five. As an example, consider Canadian Imperial Bank of Commerce (TSX: CM), which at the time of writing was trading at $124.65 with a dividend yield of 4.725%.
You could buy the shares and sell the CIBC January 130 call at $2.50 per share. The sale of the call option will reduce your per share cost to $122.15. Between now and the January 2022 expiration, you will receive three dividends amounting to $4.38, assuming CIBC does not increase the quarterly dividend before the end of 2021.
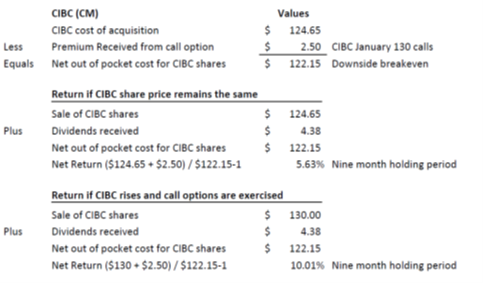
The return if the stock remains at its current price through to the January expiration will be 5.63%. If the stock rises and the shares are sold at $130 per share, the return is 10.01%.
If you are looking for a fixed-income substitute, the covered call strategy applied to mature dividend-paying stocks is an excellent alternative, not only from a rate-of-return perspective, but also because of the tax efficiency.
Return to the table of contents…
TOP PICK
Here is our Top Pick for this month. Prices are as of the close of trading on April 26 unless otherwise indicated.
The Coca-Cola Company (NYSE: KO)
Type: U.S. common stock
Current price: $53.66 (figures in U.S. dollars)
Entry level: Current price
Annual payout: $1.68
Yield: 3.1%
Risk: Moderate
Recommended by: Gordon Pape
Website: www.coca-colacompany.comThe business: Everyone knows about Coca-Cola. I doubt there’s a single person reading this that hasn’t tried at least one bottle or can. What you may not know is that Coke is just one of more than 500 drink brands offered by this company. If you sip on Sprite, Fanta, or Minute Maid orange juice, you’re drinking a Coca-Cola product. Ditto for Dasani water, Powerade, Costa coffee, and more. Coca-Cola is the world’s largest non-alcoholic beverage company, and its products are sold in more than 200 countries and territories.
The security: Coca-Cola trades on the New York Stock Exchange under the symbol KO. Average daily volume is more than 16.5 million shares. The market cap is about $235 billion.
Why we like it: The stock offers three advantages for income investors. The first is a decent yield of 3.1%. The second is a long history (more than 50 years) of annual dividend increases. The third is stability. The shares have a low beta of 0.62, which means they are much less volatile than the broad market. That works to your advantage in the event of a market correction.
Financial highlights: The company recently released results for the first quarter of 2021. Net revenues grew 5% from the previous year, to $9 billion. Operating margin was 30.2% versus 27.7% in the prior year. Comparable earnings per share on a non-GAAP basis grew 8% to $0.55.
Cash from operations was $1.6 billion, up $1.1 billion versus the prior year, driven by positive business performance, five additional days in the quarter, and working capital initiatives. Free cash flow (non-GAAP) was $1.4 billion, up $1.2 billion from 2020, primarily driven by cash from operations along with lower capital expenditures versus the prior year.
Risks: The pandemic has had a noticeable impact on the company’s business. Sales are closely linked to consumer mobility, which in turn is being driven by vaccination rates in various countries. “In the first quarter, volume trends steadily improved each month, driven by recovery in markets where coronavirus-related uncertainty has abated,” the company said. March volume was back to 2019 levels. “The path to recovery, however, remains asynchronous around the world,” the company added.
A longer-term risk to consider is that this is a highly competitive business where giants like Coke and Pepsi are in a constant struggle for market share. Any slippage could have a negative effect on the share price.
Distribution policy: Dividends are paid quarterly, in March, June, September, and December. The most recent increase was a penny a share in March, to $0.42.
Tax implications: Dividends are subject to a 15% withholding tax, unless the shares are held in a registered retirement account such as an RRSP or RRIF.
Who it’s for: The stock is suitable for investors seeking to add a stable U.S. security with dependable cash flow.
How to buy: Coca-Cola is widely traded. Any broker can acquire it for you.
Summing up: Apart from telecoms and utilities, not many U.S. blue-chip companies offer a yield of more than 3%. This is one of the best.
Action now: Buy.
Return to the table of contents…
GORDON PAPE’S UPDATES
Prices as of the close on April 26, 2021.
Procter & Gamble Co. (NYSE: PG)
Type: U.S. common stock
Current price: $131.26 (figures in U.S. dollars)
Originally recommended: Jan. 28/21 at $132.24
Annual payout: $3.48
Yield: 2.7%
Risk: Lower risk
Website: www.pg.comComments: Cincinnati-based P&G is an industry leader in the cleaning products business as well as personal health care and grooming. The long list of brands includes Tide, Bounce, Pampers, Downy, Bounty, Charmin, Always, Tampax, Gillette, Head & Shoulders, Herbal Essences, Old Spice, Pantene, Cascade, Febreze, Oral-B, Mr. Clean, Crest, Scope, Vicks, Ivory, and Secret.
The stock has barely budged from my original recommended price in January, but we’re getting more cash flow. The company raised its quarterly dividend by 10%, to $0.87 per share ($3.48 annually), effective with this month’s payment.
The company recently reported its fiscal 2021 third-quarter results (to March 31). Net sales were up 5% over the prior year, to $18.1 billion. Diluted net earnings per share were $1.26, an increase of 13% over the same period in fiscal 2020.
Looking ahead, P&G said it expects fiscal 2021 GAAP diluted net earnings per share growth in the range of 8%-10%. Last year the company reported earnings per share of $4.96.
Apart from the dividend increase, P&G is adding to shareholder value through stock repurchases. The company says it expects to spend $11 billion on buybacks in the current fiscal year.
Action now: Buy for U.S. dollar cash flow and modest capital gains potential.
CI U.S. & Canada Lifeco Income ETF (TSX: FLI)
Type: Exchange-traded fund
Current price: $10.29
Originally recommended: Jan. 26/18 at $13.79
Annual payout: $1.027 (trailing 12 months)
Yield: 9.98%
Risk: Moderate
Website: www.firstasset.comComments: This ETF invests in a portfolio of the 10 largest U.S. and Canadian life insurance companies by market capitalization. The objectives are to provide unitholders with regular quarterly cash distributions and the opportunity for capital appreciation.
The fund has delivered on the first part of its mandate. Quarterly distributions over the past 12 months have totalled almost $1.03 per unit, although they have gradually been diminishing. The latest payment, in March, was $0.194.
However, on the capital appreciation side this ETF has been a disappointment. The units are down about 25% since the original recommendation. The fund was hard-hit by the market crash in March 2020 and has yet to regain its previous high, although the trend line is up. The units dropped below $7 at one point during the pandemic selloff.
Seven of the 10 stocks in the portfolio are U.S. companies – the Canadian entrants are Great-West Life, Sun Life, and Manulife. The largest positions are in Lincoln National Corp., Met Life, Prudential Financial, and Principal Financial Group, although since this is a more-or-less equally weighted fund, the allocation differences are small.
Action now: Hold. The units are gradually moving higher, and the yield at this point is very attractive.
BMO Emerging Markets Bond Hedged to CAD Index ETF (TSX: ZEF)
Type: Exchange-traded fund
Current price: $15.39
Originally recommended: Jan. 30/20 at $15.64
Annual payout: $0.66 (forward 12 months)
Yield: 4.3%
Risk: Medium
Website: www.bmo.comComments: This fund invests in U.S. dollar-denominated government bonds from emerging market issuers. The U.S. dollar exposure is hedged back to Canadian dollars. Among the countries represented in the portfolio are Russia, Turkey, China, Brazil, Indonesia, and Mexico.
This has not been a good year for bonds, but the unit price has held its own, and the monthly distributions of $0.055 per unit ($0.66 per year) have given us a slight gain overall.
That said, this is a very specialized fund and should be held only by those who want specific exposure to emerging markets.
Action now: Hold.
Harvest Healthcare Leaders Income ETF (TSX: HHL.U)
Type: Exchange-traded fund
Current price: $8.48 (figures in U.S. dollars)
Originally recommended: June 29/18 at $8.11
Annual payout: $0.696
Yield: 8.2%
Risk: Moderate
Website: www.harvestportfolios.comComments: This ETF invests in an equally balanced portfolio of 20 leading health service companies, including insurers, equipment manufacturers, biotechnology, and pharmaceutical companies. Pharmaceuticals account for 44% of the portfolio. Some of the top names include Boston Scientific, Anthem, Abbott Laboratories, AbbVie, and Stryker Corp. All are large-cap companies (minimum capitalization is $5 billion) and most are U.S.-based. The managers write covered call options on a portion of the holdings to generate additional cash flow.
There are three investment options: HHL.U is denominated in U.S. dollars; HHL is hedged back into Canadian dollars and priced in loonies; HHL.B is also priced in Canadian dollars but is unhedged.
The chart looks very choppy, but the broad trend over the past year has been up, and we’re back into positive territory in terms of our recommended price. The U.S.-dollar units pay a monthly distribution of $0.058.
Action now: Hold.
Return to the table of contents…
YOUR QUESTIONS
Tax-efficient retirement
Q – I’m trying to help structure a portfolio for a friend who will soon have very little income when she retires – she will likely be eligible for the GIS (Guaranteed Income Supplement). Her TFSA is maxed out, so we are talking about income from a non-registered account.
My inclination is to buy some stable dividend paying stocks and lock in a yield of say 4%. The problem is that the grossed-up amount of the dividend counts as income for GIS purposes and so will reduce her GIS much more than interest, or, even better, capital gains. It seems that dividends will reduce GIS at 70 cents on the dollar, interest 50 cents, and capital gains 25 cents.
I could buy a growth-oriented portfolio and harvest some capital every year (capital gains), but some years it might go down. Is there any other way to essentially get stable dividend income, but receive it as interest or capital gains?
Thanks for your great newsletters. My retirement well-being is riding on them! – Ian K.
A – I have two suggestions to consider. The first is to invest some of her money in a stable mortgage investment corporation (MIC), such as Firm Capital (TSX: FC), a long-time recommendation of The Income Investor. Distributions from MICs are called dividends, but they are actually taxed as interest. That means they aren’t eligible for the dividend tax credit, and hence, the gross-up that would have a negative impact on her GIS payments doesn’t become a factor. Of course, the whole amount of the distributions will be taxable, but since she will be in a low tax bracket, that should not be a major concern. Firm Capital currently yields just under 7%.
My second suggestion is to look at corporate class mutual funds, which group a large selection of funds within a single corporation. Most major fund companies offer them. The wide range of mandates within the corporation enables you to construct a portfolio that is risk appropriate. All the distributions are in the form of capital gains dividends, non-taxable return of capital, or eligible Canadian dividends. Check the distribution history of any corporate class fund you’re considering before making a decision. – G.P.
Tax advantages of REITs
Q – Can you explain the tax advantages of REITs. I own several of them, particularly in my TFSA. – Brian E.
A – Most REITs do offer some tax breaks in terms of their distributions, but they are of no value in a TFSA. The units need to be held in an unregistered account.
The composition of the distributions, and hence the tax advantages, will vary from one REIT to another. You can usually find the information on the REIT’s website. For example, in 2020 only about 60% of the payout from RioCan REIT was fully taxable. Almost 18% was in the form of capital gains (taxed at a lower rate). About 23% was return of capital, which is not taxed in the year received. Instead, the cost base is adjusted to reflect such payments, which will increase capital gains tax exposure when the units are sold. – G.P.
Closed-end funds
Q – I just read an article about closed end funds (CEFs), which is the first time I’ve ever heard of them. The writer claimed that they pay 7% on average, which I believe in this day is amazing! Some people compare them to ETFs but with a higher risk. Why do we not hear more about them? – Norman L.
A – If it sounds too good to be true, it probably is. Closed-end funds have been around for many years and were once very popular. Then people began to discover some things they didn’t like. For one, many of them trade at a discount to their net asset value, and sometimes that discount is substantial. For another, a fund may not earn enough profit in a given year to sustain its distribution, but instead of cutting the payout, it pays back part of your capital.
That said, some of these funds are worth a look. The Canoe Income Fund (TSX: EIT) is a recommendation of The Income Investor. It was selected in January 2019 at $10.95. At the time of writing, it was trading at $11.48 and paying a monthly dividend of $0.10 a unit, or $1.20 a year. That’s a yield of 10.5%. The risk is that this is an all-stock fund. If the market crashes, the value of the units will follow. – G.P.
That’s all for this issue. The next Update Edition will be published on May 13.
Best regards,
Gordon Pape, editor-in-chief
Circulation matters: customer.service@buildingwealth.caAll material in The Income Investor is copyright Gordon Pape Enterprises
Ltd. and may not be reproduced in whole or in part in any form without
written consent. All recommendations are based on information that is
believed to be reliable. However, results are not guaranteed and the
publishers and distributors of The Income Investor assume no liability
whatsoever for any material losses that may occur. Readers are advised to
consult a professional financial advisor before making any investment
decisions. Contributors to The Income Investor and/or their companies or
members of their families may hold and trade positions in securities
mentioned in this newsletter. No compensation for recommending particular securities or financial advisors is solicited or accepted.Privacy Policy: https://buildingwealth.ca/privacy-policy